| State | Rate |
| 1. District of Columbia | 38.68 |
| 2. Pennsylvania | 34.16 |
| 3. Wisconsin | 30.93 |
| 4. Michigan | 30.89 |
| 5. Indiana | 30.74 |
| 6. Arizona | 29.90 |
| 7. Louisiana | 29.28 |
| 8. Nevada | 27.71 |
| 9. Oklahoma | 27.06 |
| 10. Missouri | 27.01 |
| 11. Tennessee | 25.20 |
| 12. California | 25.13 |
| 13. Kansas | 24.10 |
| 14. Maryland | 23.73 |
| 15. Arkansas | 22.79 |
| 16. Ohio | 22.34 |
| 17. Minnesota | 21.58 |
| 18. Vermont | 21.24 |
| 19. West Virginia | 19.70 |
| 20. Alabama | 19.61 |
| 21. Illinois | 18.62 |
| 22. New Jersey | 18.19 |
| 23. Texas | 18.00 |
| 24. Colorado | 17.89 |
| 25. South Carolina | 16.64 |
| 26. Virginia | 16.26 |
| 27. Kentucky | 16.16 |
| 28. New Mexico | 16.00 |
| 29. North Carolina | 15.40 |
| 30. Alaska | 15.39 |
| 31. Utah | 15.02 |
| 32. New York | 14.76 |
| 33. Washington | 14.53 |
| 34. Iowa | 14.29 |
| 35. Delaware | 14.00 |
| 36. Oregon | 13.94 |
| 37. Georgia | 13.54 |
| 38. Massachusetts | 13.45 |
| 39. Wyoming | 12.57 |
| 40. Rhode Island | 11.77 |
| 41. Mississippi | 11.20 |
| 42. Connecticut | 10.57 |
| 43. Hawaii | 9.14 |
| 44. Montana | 8.78 |
| 45. South Dakota | 8.69 |
| 46. North Dakota | 8.41 |
| 47. Idaho | 8.28 |
| 48. Maine | 4.42 |
| 49. Nebraska | 3.68 |
| 50. New Hampshire | 2.23 |
The next table comes from Audacious Epigone: White Murder Rates by State
Keep in mind that since Hispanic crime rates are not separated from white crime rates, it is highly likely that Hispanic perpetrators were involved in most of the murders designated as having been committed by "whites," in states containing an appreciable Hispanic population. That is one of the quirks in the US system of crime reporting.
| State | Rate |
| 1. District of Columbia | 12.43 |
| 2. Nevada | 6.64 | 3. New Mexico | 6.63 |
| 4. Arizona | 6.43 |
| 5. California | 5.81 |
| 6. Oklahoma | 4.45 |
| 7. Texas | 4.38 |
| 8. Alaska | 4.12 |
| 9. Hawaii | 3.64 |
| 10. Maryland | 3.52 |
| 11. South Carolina | 3.52 |
| 12. Tennessee | 3.51 |
| 13. Louisiana | 3.42 |
| 14. Missouri | 3.42 |
| 15. West Virginia | 3.05 |
| 16. Arkansas | 3.00 |
| 17. Alabama | 2.91 |
| 18. North Carolina | 2.90 |
| 19. Colorado | 2.86 |
| 20. Georgia | 2.68 |
| 21. Kentucky | 2.66 |
| 22. Kansas | 2.51 |
| 23. Wyoming | 2.49 |
| 24. Virginia | 2.44 |
| 25. Washington | 2.43 |
| 26. Indiana | 2.41 |
| 27. New York | 2.35 |
| 28. New Jersey | 2.27 |
| 29. Mississippi | 2.21 |
| 30. Michigan | 2.19 |
| 31. Pennsylvania | 2.16 |
| 32. Idaho | 2.10 |
| 33. Connecticut | 2.03 |
| 34. Oregon | 1.98 |
| 35. Montana | 1.84 |
| 36. Rhode Island | 1.84 |
| 37. Massachusetts | 1.74 |
| 38. Ohio | 1.73 |
| 39. Delaware | 1.69 |
| 40. Utah | 1.63 |
| 41. Maine | 1.60 |
| 42. Vermont | 1.58 |
| 43. Wisconsin | 1.34 |
| 44. Illinois | 1.27 |
| 45. South Dakota | 1.21 |
| 46. Nebraska | 1.19 |
| 47. North Dakota | 1.19 |
| 48. Iowa | 1.14 |
| 49. Minnesota | 0.91 |
| 50. New Hampshire | 0.86 |
One of the interesting observations is how much higher black murder rates are than "white" rates, even when murders by Hispanics are added to murders by "whites."
Stratification of US murder rates by race will show that blacks have the highest murder rates, hispanics the next highest, whites the third highest, and asians have the lowest murder rates. In the UK, Europe, and Australia, the rankings would vary somewhat due to different immigrant populations.
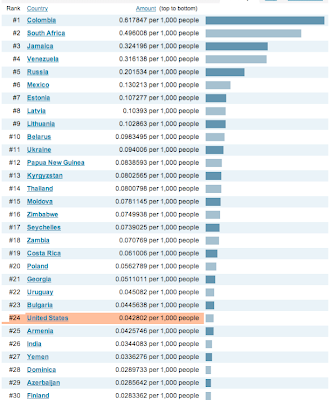
Following are some international homicide rate comparisons:


1 comment:
Very insightful. I'm glad to see someone who is not afraid to stand up and speak plainly about this kind of thing.
Post a Comment