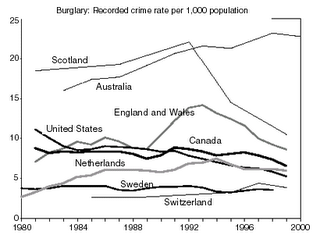
 Everyone is fascinated with crime statistics, particularly people who have been victimised by crime, or know someone who has been victimised. Take the graph above. Many people will mentally extrapolate the existing curves for each country to supply up to date rates, but is that accurate? No--for reasons of changing demographics, particularly in Europe, and in the more multicultural regions of North America, Australia, and other developed regions.
Audacious Epigone has posted an article that looks at the relationship between "race" and "crime." Using multivariate regression, he found that knowledge of the percent black and/or hispanic in a given population, gives an "r" correlation coefficient of 0.800, which is very high. When he combined the following variables together statistically, the r was only 0.689. (don't add the coefficients arithmetically, or people will laugh at you)
% of population in poverty: .399
% of population with a bahelor's degree: .289 (inverse)
State gini coefficient: .627
% of population owning at least one gun: .060 (inverse, not statistically significant)
% of population with a high school diploma: .388 (inverse)
% of population unemployed: .309
Go the Audacious Epigone's article yourself and look over his methodology. These are his statistics, which he compares to findings of others. Here is an Al Fin Potpourri article looking at a similar topic.
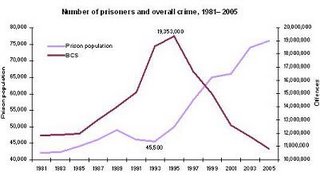
 Another interesting variable that would be interesting to look at using the same method, is prison population. This graph shows the New York experience in the 1990s.
For all the people who check their parking spot to see if their car is still there, almost every day, crime is not a joke. For all the people who balance the enjoyment they would get out of the opera, ball game, or concert, with the chance of being mugged or worse, crime is not merely a political issue. For all the people who have their lunch money taken more often than not, crime is not an academic issue.
No comments:
Post a Comment